This segment illustrates an example of a valuation analysis prepared on Electronic Arts in 2014.
HISTORIC SHARE PRICE PERFORMANCE

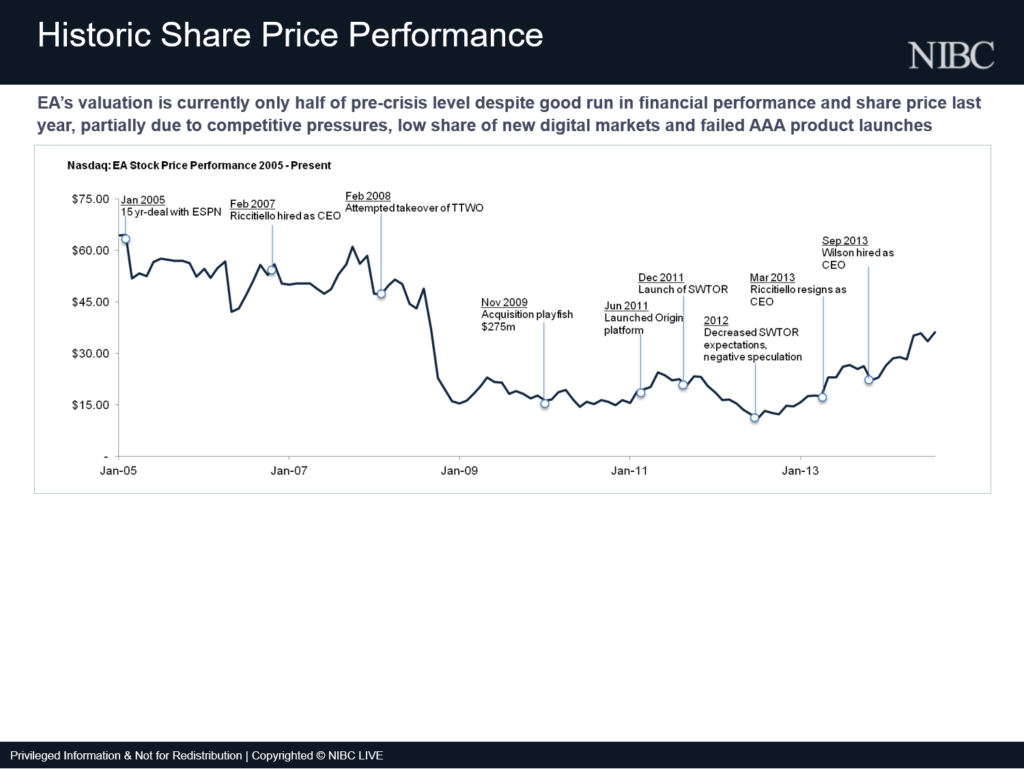
To provide some context for the valuation discussion, here is a chart showing the stock price performance of EA going back to 2005. We chose to go back quite far to show the stock’s performance before and during the financial crisis. As can be seen, the stock has been trading at healthy valuations up to the financial crisis, then dropped severely and remained depressed until recent years. Looking at some key events indicates that EA had some trouble with overall customer satisfaction and generating blockbuster titles, which put pressure on its operating performance. However, the stock has been on an upward trajectory since in 2013 including after the appointment of a new CEO focused on operational efficiencies.
VALUATION OVERVIEW

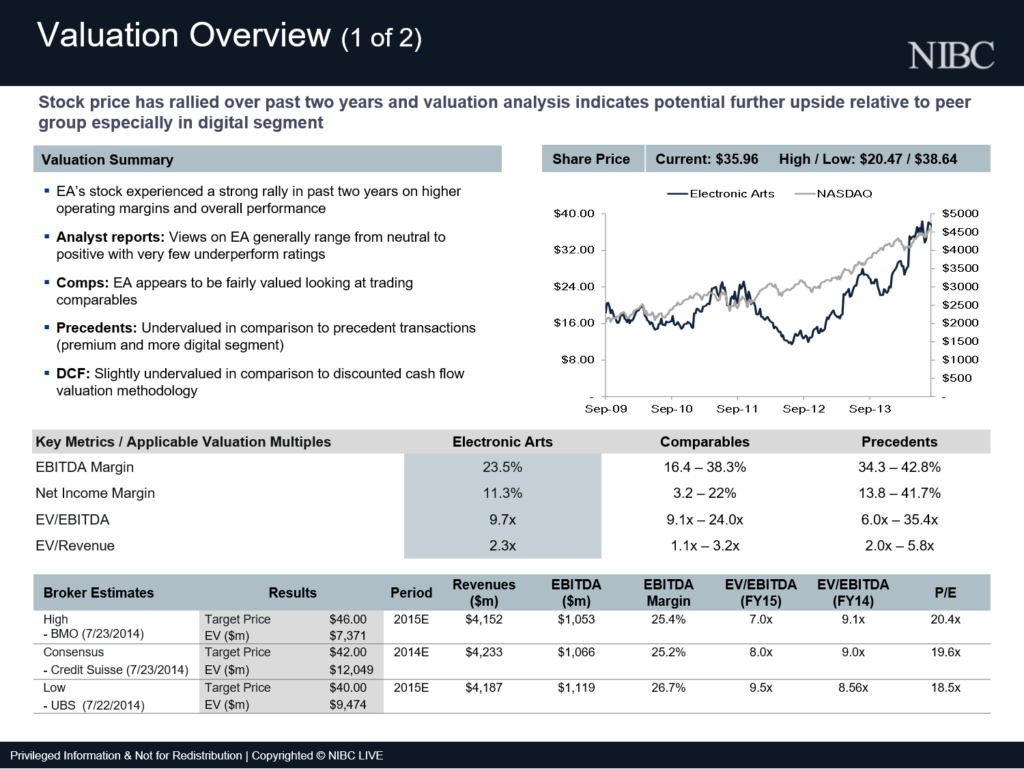
This slide provides an overview of the results of various valuation methods including EA’s stock price, analyst reports, trading comparables, precedent transactions and a discounted cashflow model. As can be seen, the stock price has been on an upward trajectory in recent years and analysts are broadly suggesting that the stock has significant room to grow from its current price. Looking at the EV/EBITDA and EV/Revenue ranges of comps and precedents, EA appears to be trading at the bottom of the range, which also suggests EA could be undervalued.

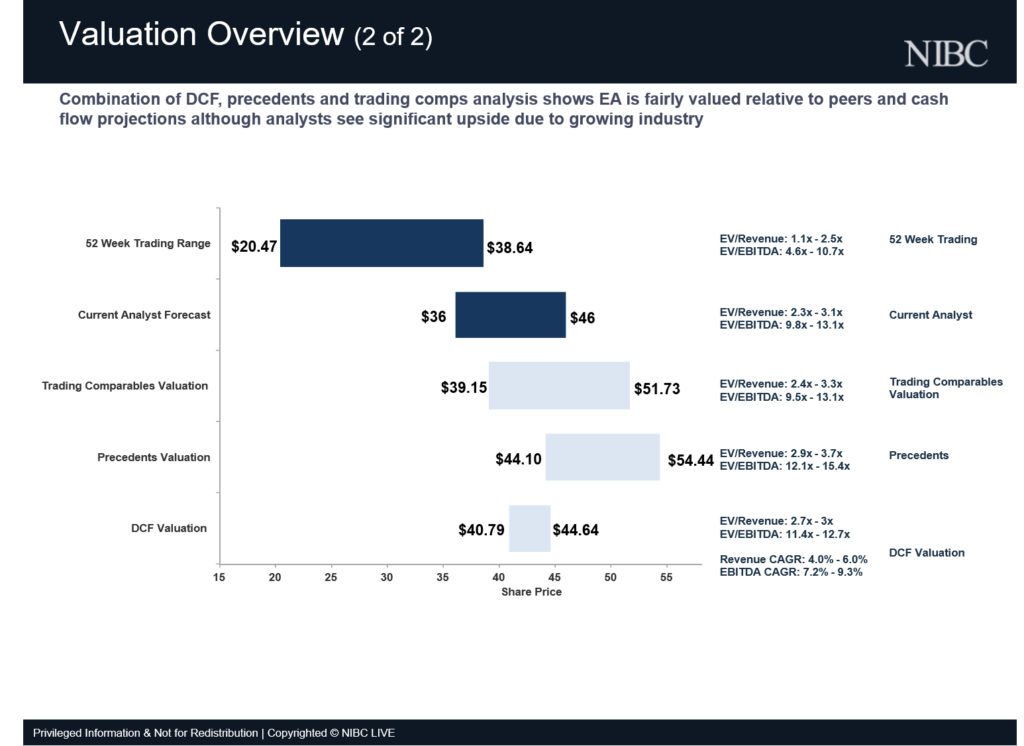
This slide provides a graphical illustration of the valuation results, which again show that EA is trading closer to the bottom of its valuation potential with ample room to grow. As you can see on the right side, we have included the EV/Revenue and EV/EBITDA figures corresponding to the upper and lower bound of each valuation method. This helps put ranges into perspective.Next to the DCF, we also indicated what compounded annual growth rates for revenues and EBITDA correspond to the upper and lower bounds during the forecast period.
It should be noted that valuation can sometimes be a bit of an art rather than pure science. Each valuation method leaves a fair amount of room for subjective adjustment and interpretation, so the common practice is to show a range of valuation results for each method. Bearing this in mind, the valuation ranges produced by the different methods should portray a somewhat logical picture that is consistent with your conclusions about the company’s stock price. This may require some adjustment to the underlying assumptions, selection of comparables, and selection of upper and lower bounds, which can be explained in footnotes. In contrast, showing valuation results to a client that are mathematically correct but don’t make any intuitive sense will most certainly not further a pitch.
FINANCIAL FORECAST

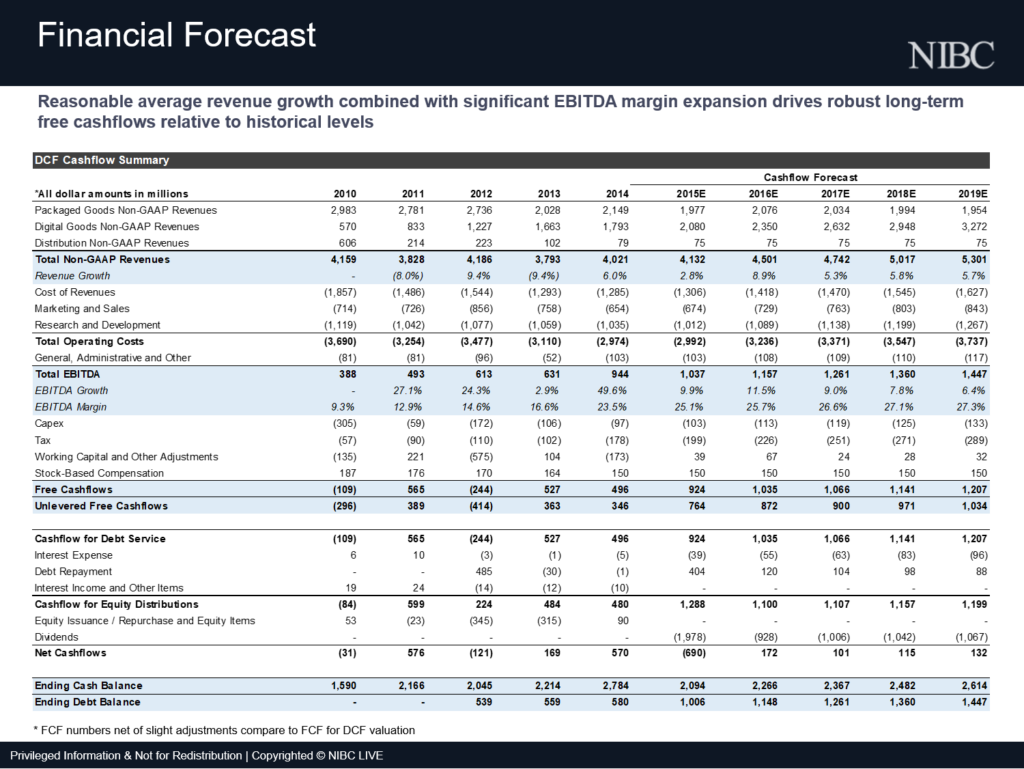
The next slide shows the summary model outputs from the financial forecast. Although the financial forecast is mainly reflected in the discounted cashflow method, we included these outputs upfront because they provide important context for the valuation analysis.
VALUATION ANALYSIS

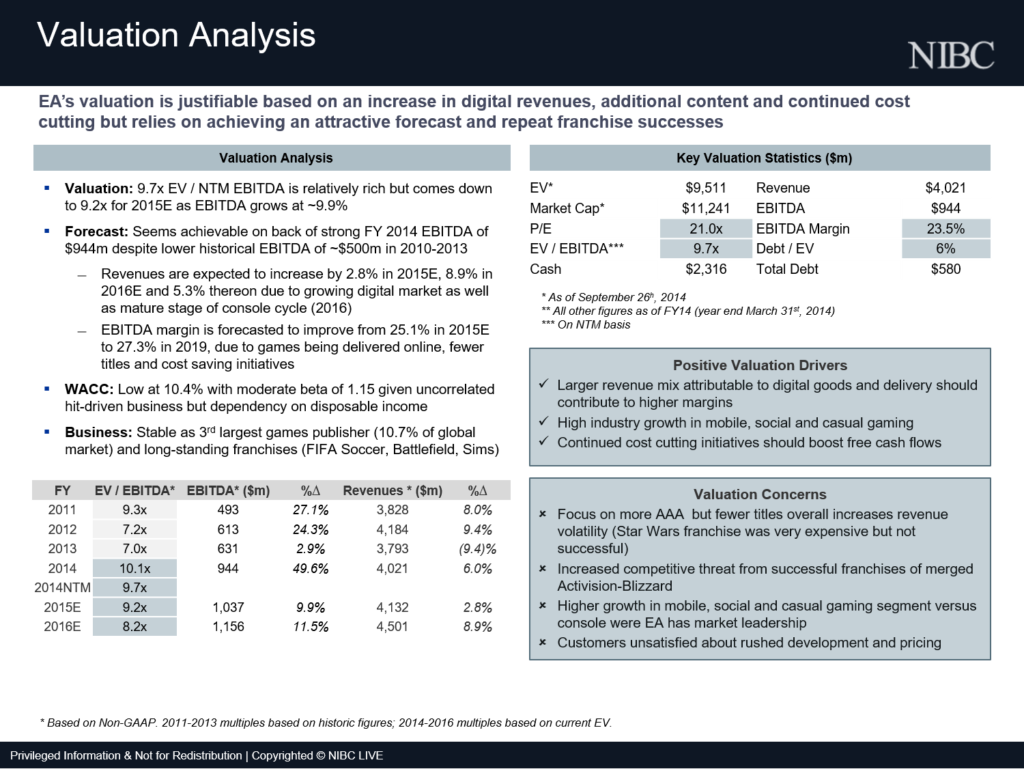
This slide represents an internal qualitative analysis of EA’s current valuation based on forecasted cashflows and specific drivers. The main premise is that EA is currently trading at a higher EV/EBITDA multiple relative to historical levels. However, this would be justified if EA is able to realize its projected growth in EBITDA. This is further demonstrated by the declining forward EV multiples for the Next Twelve Month, 2015 and 2016 EBITDA as the company effectively “grows into its multiples”. A comparison of the projected performance to historical levels indicates that EA’s operating performance markedly improved in 2014 and needs to continue growing from a relatively high base to achieve its forecast. However, this growth is supported by a number of plausible valuation drivers, in particular the shift from physical to digital product delivery, and the high growth in social and mobile gaming where EA made two recent strategic acquisitions.
TRADING COMPARABLES

This slide provides some additional detail on the trading comparables analysis and specific calculations to derive an implied share price for EA.
We can segment EA’s revenues and EBITDA into a console and mobile segment, in order to value each segment individually based on a separate set of comparable companies.
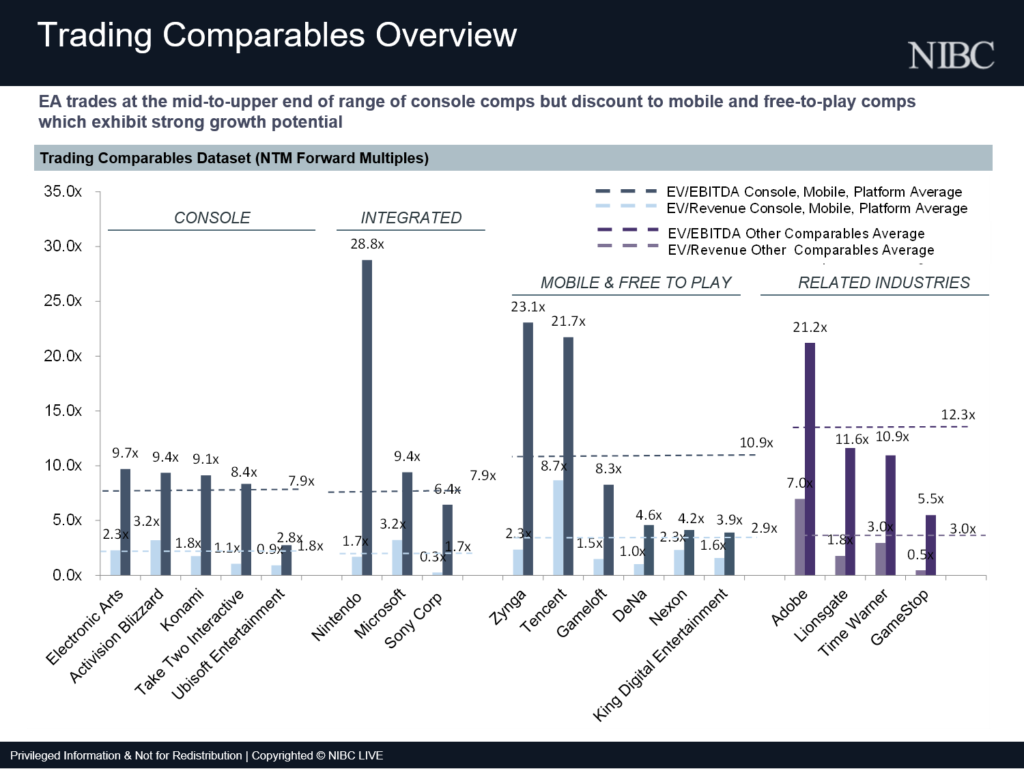
The chart here shows the EV/Revenue and EV/EBITDA multiples of a broad set of peers broken into 4 groups. They consist of:
- Console and PE publishers which are most comparable to EA’s packaged goods segment.
- Integrated platform publishers which are also comparable to EA’s packaged goods segment, but provide many other products and services.
- Mobile and Free to Play Publishers, which are most comparable to EA’s digital segment. As can be seen, successful publishers trade at a premium to console publishers given high growth in the sector.
- Other related companies in the filmed entertainment and software development sectors. Though none of these companies are exact comparables, they could provide some perspectives on how companies with related businesses and risk profiles are valued. As such, we decided to display a broader set of comps for reference.

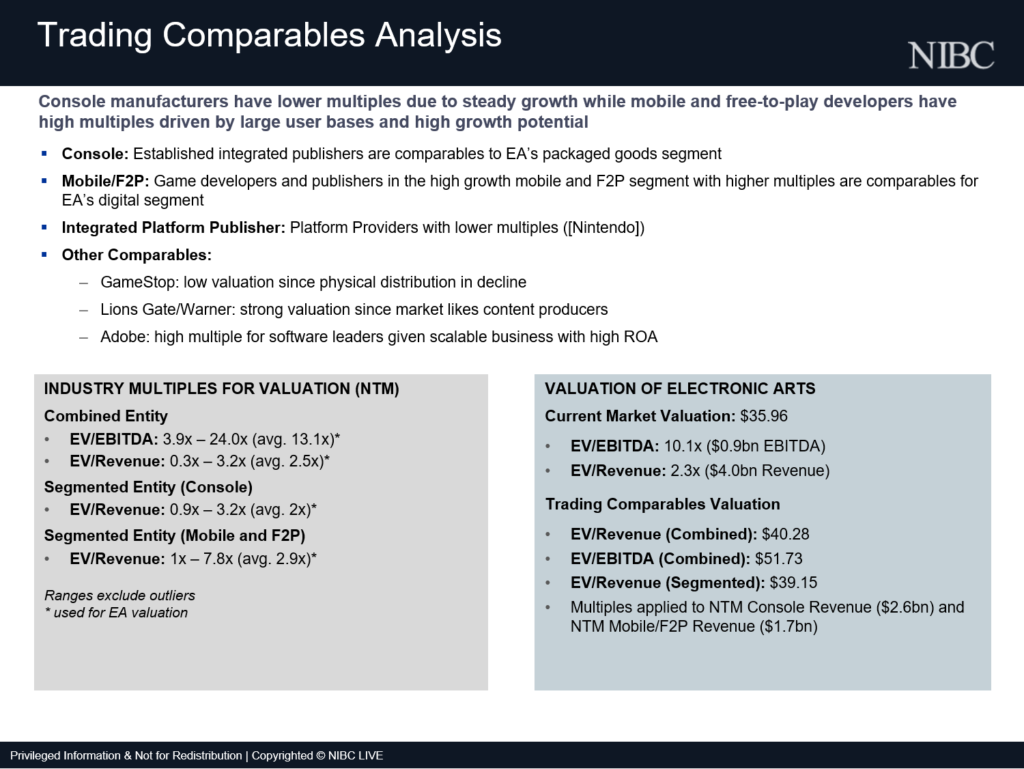
This slide shows some of the calculations and qualitative conclusions drawn from the comps set. Console manufacturers are characterized by lower multiples due to steady growth and stable revenues. Mobile and Free to Play Developers by contrast are characterized by higher multiples due to high growth potential and large user bases. With regards to calculating industry multiples to apply to EA, note that we excluded certain outliers, which can be summarized in an appendix. A you can see on the top left that we calculated implied industry multiples for 3 sets to comparable companies:
- All comparables in the combined data set
- Comparables in the Console & PC segment
- Comparables in the Mobile & Free-to-Play segment
On the top right, you can see the industry multiples we used to establish an upper and lower bound for the valuation range. This is also the range shown in the football field earlier.
Note that there is some flexibility on picking multiples to establish upper and lower bounds as long as you explain which datapoints are used to calculate the multiples and the results are not misleading.

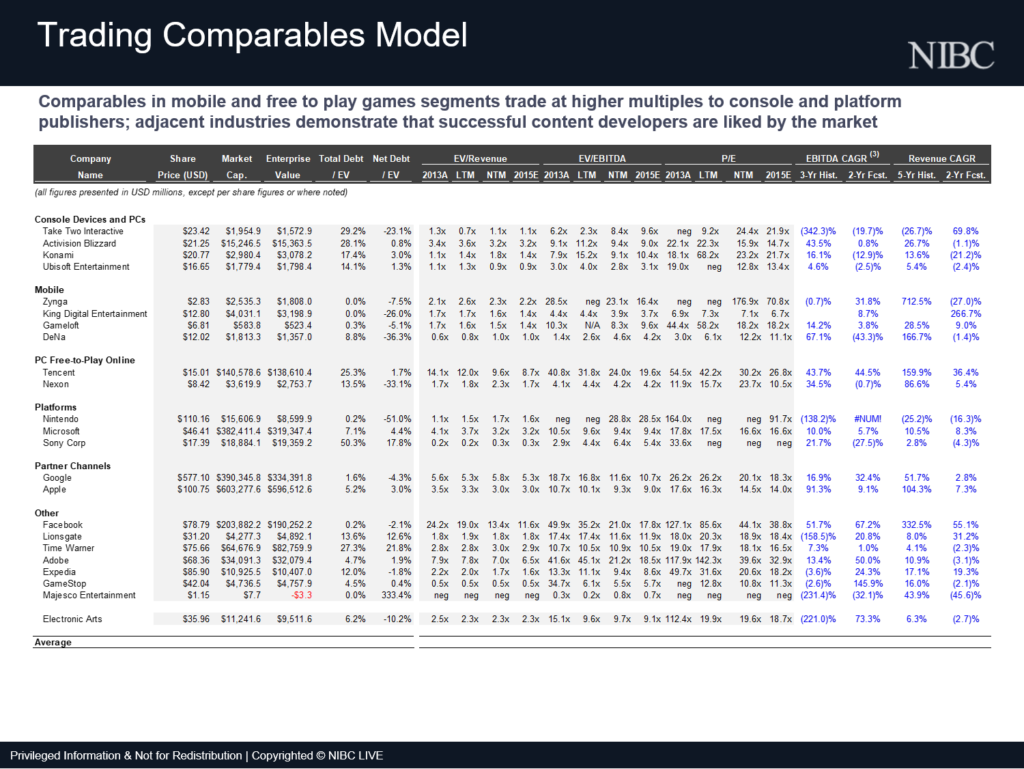
This slide summarizes the dataset for trading comparables, from which the previous slide was constructed.
PRECEDENT TRANSACTIONS

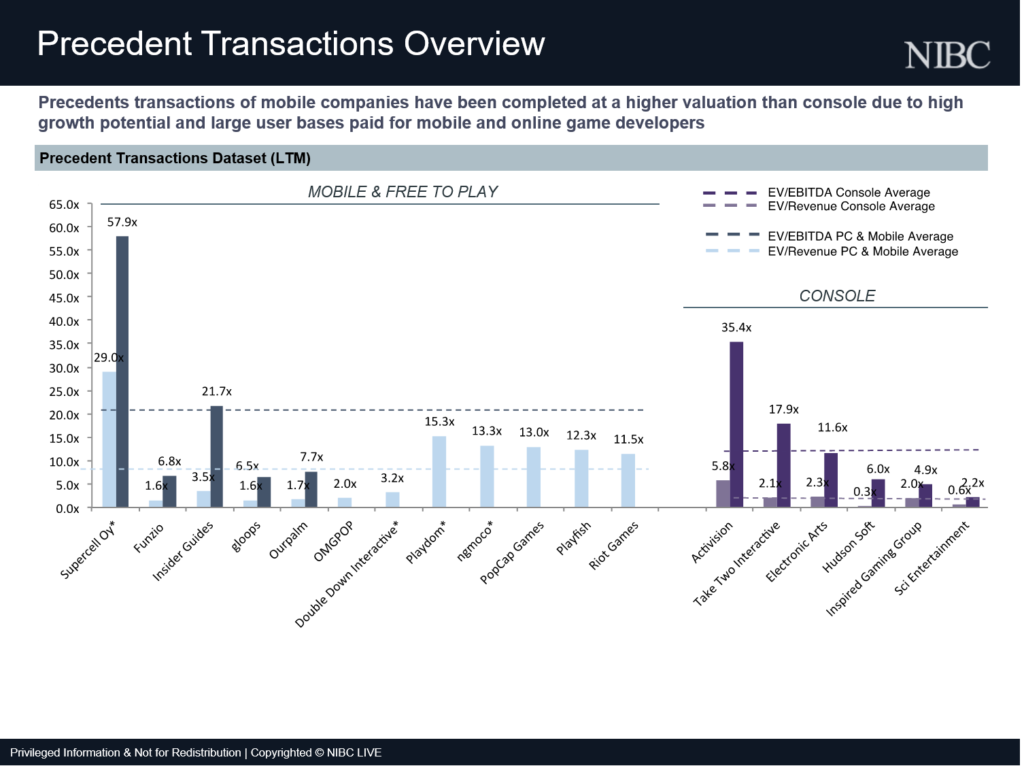
This slide provides an overview of the precedent transaction analysis, which follows the same framework as the trading comparables analysis. As you can see, we limited the dataset for precedent transactions to two groups comprising Free to Play Games and Console Game manufacturers.

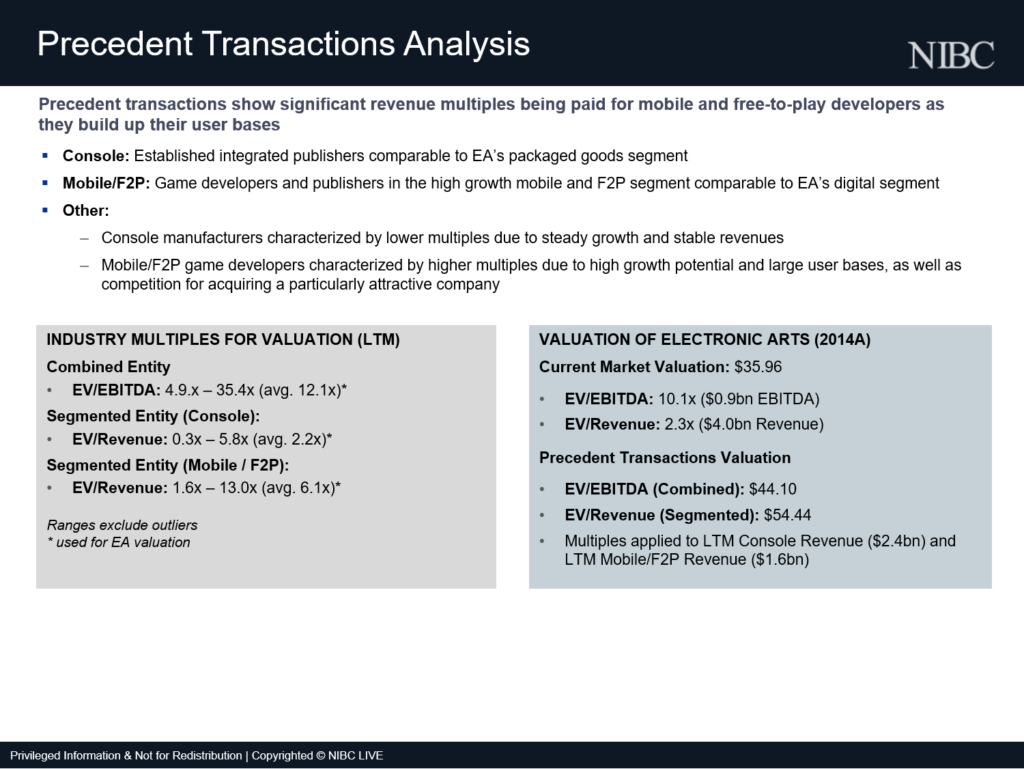
Similarly, this slide shows observations and calculations for precedent transactions, which are analogous to those performed for trading comparables. We first calculate implied industry multiples based on the combined and segmented datasets. We then select the industry multiples we want to use to set the upper and lower bounds of EA’s valuation range.

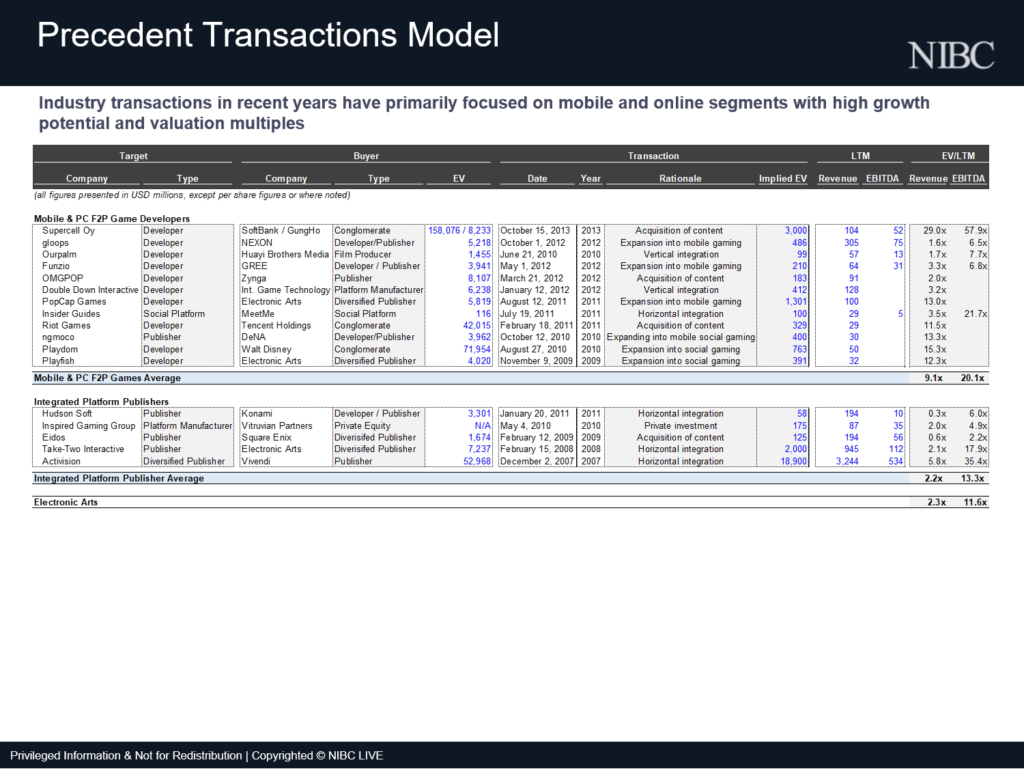
This slide show a summary of the precedents dataset used for the previous calculations.
DISCOUNTED CASHFLOWS


And lastly, this slide summarizes the results of the free cashflow calculation including:
- Key operating assumptions
- Calculation of free cashflows
- calculation of terminal value, WACC and share price